IterativeInversionResult#
- class ctis.inverters.IterativeInversionResult(solutions, success, images, inverter, message, num_iteration, mean_chi_squared, correlation_residual)[source]#
Bases:
AbstractInversionResultThe results of an iterative inversion attempt.
Attributes
The correlation between the predicted images and the residuals for each iteration.
The observed images on which the inversion was performed.
The inversion algorithm instance that produced these results.
The iteration value for each iteration.
The mean chi squared statistic for each iteration.
Any message from the inversion routine concerning the results.
The number of iterations performed by the inverter.
The reconstructed scene found by the inversion.
A boolean flag indicating whether the inversion was successful.
Intermediate solutions from each iteration.
Methods
__init__(solutions, success, images, ...)plot_moments(truth, axis[, num_bins, ...])Plot column-normalized 2D histograms of the true vs. reconstructed radiance, median, and interquartile range of the spectral line profile.
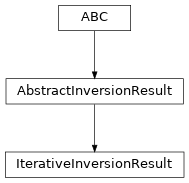
Inheritance Diagram
- Parameters:
solutions (FunctionArray[SpectralPositionalVectorArray, ScalarArray])
success (bool)
images (FunctionArray[SpectralPositionalVectorArray, ScalarArray])
inverter (AbstractInverter)
message (str)
num_iteration (int)
mean_chi_squared (ScalarArray)
correlation_residual (ScalarArray)
- plot_moments(truth, axis, num_bins=50, range_radiance=None, range_median=None, range_iqr=None, percentile_radiance=0)#
Plot column-normalized 2D histograms of the true vs. reconstructed radiance, median, and interquartile range of the spectral line profile.
- Parameters:
truth (FunctionArray[AbstractDopplerPositionalVectorArray, ScalarArray]) – The true scene which will be compared to the reconstructed scene.
axis (str) – The axis along which to compute the radiance, median, and interquartile range.
num_bins (int) – The number of bins along each axis of the histogram.
range_radiance (None | tuple[Quantity, Quantity]) – The domain of the radiance histogram.
range_median (None | tuple[Quantity, Quantity]) – The domain of the median histogram.
range_iqr (None | tuple[Quantity, Quantity]) – The domain of the interquartile range histogram.
percentile_radiance (float) – Spatial locations below this threshold are excluded from the histogram. The default is to not exclude any pixels.
- Return type:
- correlation_residual: ScalarArray = <dataclasses._MISSING_TYPE object>#
The correlation between the predicted images and the residuals for each iteration.
- images: FunctionArray[SpectralPositionalVectorArray, ScalarArray] = <dataclasses._MISSING_TYPE object>#
The observed images on which the inversion was performed.
- inverter: AbstractInverter = <dataclasses._MISSING_TYPE object>#
The inversion algorithm instance that produced these results.
- property iteration: ScalarArray#
The iteration value for each iteration.
- mean_chi_squared: ScalarArray = <dataclasses._MISSING_TYPE object>#
The mean chi squared statistic for each iteration.
- message: str = <dataclasses._MISSING_TYPE object>#
Any message from the inversion routine concerning the results.
- num_iteration: int = <dataclasses._MISSING_TYPE object>#
The number of iterations performed by the inverter.
- property solution: FunctionArray[SpectralPositionalVectorArray, ScalarArray]#
The reconstructed scene found by the inversion.
- solutions: FunctionArray[SpectralPositionalVectorArray, ScalarArray]#
Intermediate solutions from each iteration.
If
AbstractIterativeInverter.intermediateis set toTrue, this has up tonum_iterationelements along theaxis_iterationlogical axis. Otherwise this has only one element along theaxis_iterationaxis.